Since the BOINC cluster is up and running we need to know if the whole system is healthy. Even if you have just the minimal suggested amount of nodes attached to your master, it is already challenging to check all the parameters like uptime, CPU or RAM usage from each of your nodes and pods. Luckily there is a carlosdp, who has already published a fully fledged Kubernetes Monitoring stack suitable for ARM on github. Thank you Carlos !
Carlos assembled a bunch of components together into a ready to use package. Basically Prometheus and kube-state-metrics are used to collect data from the Kubernetes Cluster. All of these data can be visualized Grafana, which is fully accessible from outside the cluster. You can also configure an SMTP relay for gmail if you Grafana notifications mailed to your inbox.
Installation is pretty straight forward and described on github. Download the package, customize the vars.jsonnet to you needs, compile all together and apply the manifests.
When the manifests have been deployed successfully, you will find a namespace monitoring on your Kubernetes Cluster and a couple of pods on each node which are collecting the monitoring data. The Grafana dashboard will be accessible via https://grafana.<your.master.node.ip>nip.io. Carlos has already prepared a lot of Grafana dashboards which will give all the informations you need.
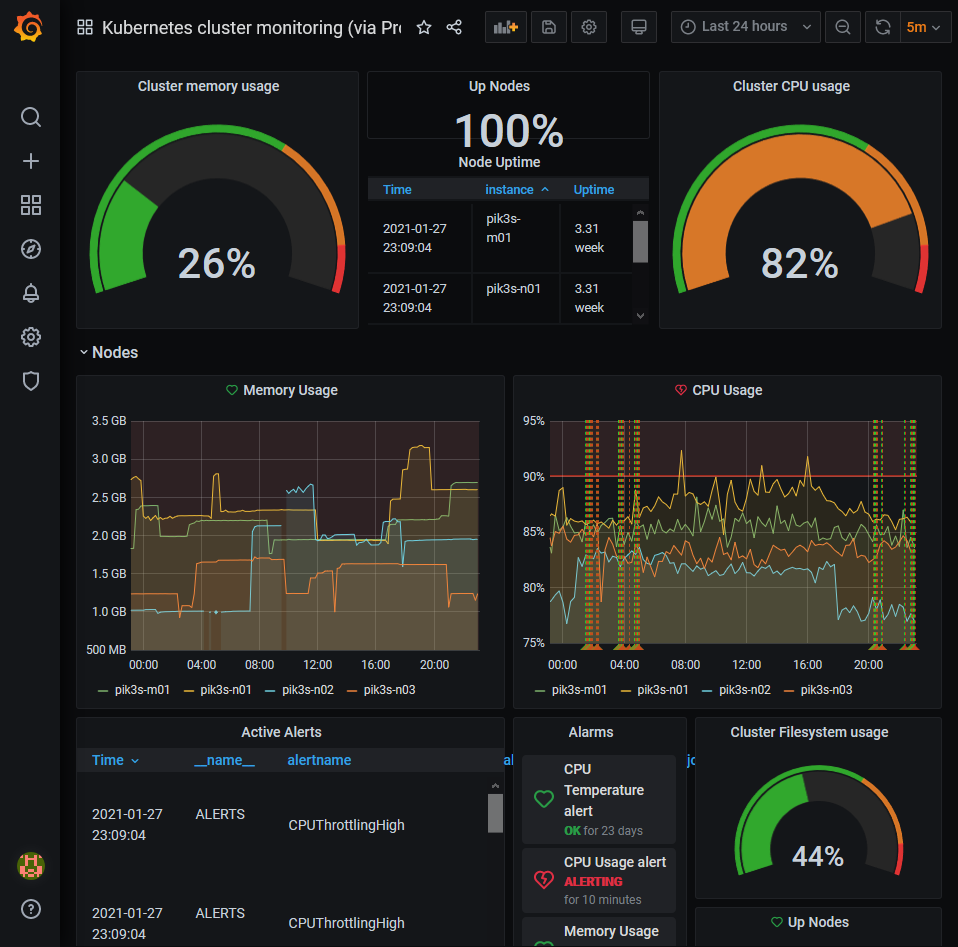
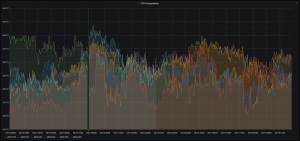
With the enabled Kubernetes monitoring suite I found out that Node2 of my cluster has a tendency to reboot itself quite often. Sometimes it reboots twice a day. I also recorded uptimes for a couple of days also. The basic system logs like syslog, messages, debug or kernel.log did not yet deliver any visible entries for me which might are responsible for the reboot. I need further investigation here.